Reports
The Reports module is your workspace for building, saving, sharing, and exporting views of your sponsorship data — slots and deals, with filters, custom columns, charts, and CSV/JSON exports.
Reports is available on every plan. Starter includes the last 30 days of analytics. Pro and Custom include full analytics history, exports, and report sharing.
The Reports page is your workspace for building, saving, sharing, and exporting views of your sponsorship data. You can switch between Slots reports and Deals reports depending on the question you are trying to answer.
Looking for workspace-wide performance dashboards, goals, and revenue recognition? Those live in the Metrics module.
Slots and Deals reports
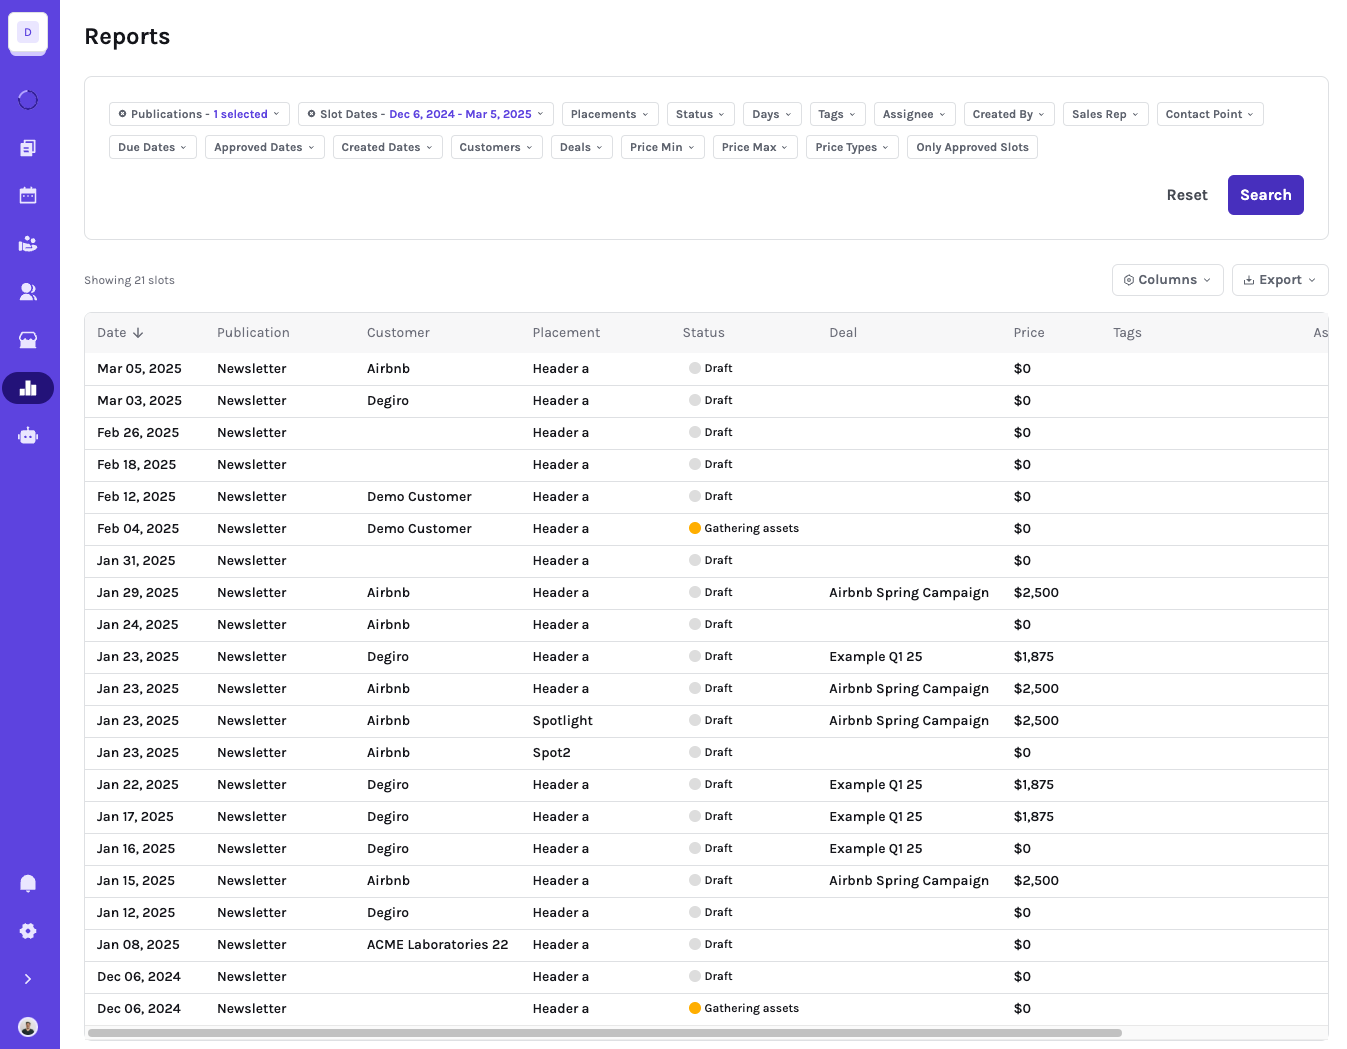
Use Slots reports when you want to analyze placement-level performance, content status, publication dates, customers, tags, metrics, and booked inventory.
Use Deals reports when you want to analyze pipeline, revenue, deal status, sales reps, customers, and deal line items. Deal reports can include the individual line items that make up a deal, so you can export the same campaign broken down by publication, placement, date, and price. Deals reports include archived deals unless you filter them out with the Archived filter; deleted deals are never included. See what happens to revenue when you archive or delete a Deal.
Filtering Data
At the top of the Reports page, you’ll find filters that allow you to drill down into specific data points. Reports support fixed date ranges as well as dynamic date ranges, such as "Last 30 days", so saved reports can stay current without manual updates.

Finding deals ready for follow-up
In Deals reports, add the Reporting readiness filter to find campaigns whose last included unit ended at least a chosen number of days ago. Choose the waiting period and any placements to exclude from the calculation. Excluding a placement leaves its units on the deal; those units do not determine when the deal becomes eligible for this report.
For example, a campaign's last ad ends on October 10 while a discount code remains active until December 31. With a 14-day waiting period and the discount-code placement excluded, the deal becomes eligible on October 24.
The calculation uses each booked unit's end date, or its scheduled date for a single-day unit. The waiting period uses UTC calendar days, and a deal qualifies on its calculated ready date. An included unit that has not been booked or has no usable date keeps the deal out of the results. Deals containing only excluded units do not qualify. Rescheduling a unit recalculates eligibility without changing the deal's progress or fulfillment date.
Add the optional Report ready date column to see the date calculated from the active readiness rule. It is separate from any custom field used to record when a report was sent.
Combine this filter with an empty date custom field, such as Report Send Date, to build a queue of campaigns awaiting a report. Record the send date after sending the report to remove that deal from the queue. The calculated eligibility date and the date you record as sent serve different purposes; Sponsy does not send the report when either date is reached or edited.
Save the report to reuse its waiting period and placement exclusions. Other reports keep their existing filters and behavior.
Readiness results use pages when there are more matches than the table can show at once. Use Previous and Next to reach the other deals. The result count shows the current range and total matches. The table, charts and exports use the current page; changing filters returns you to the first page.
Customizing Columns
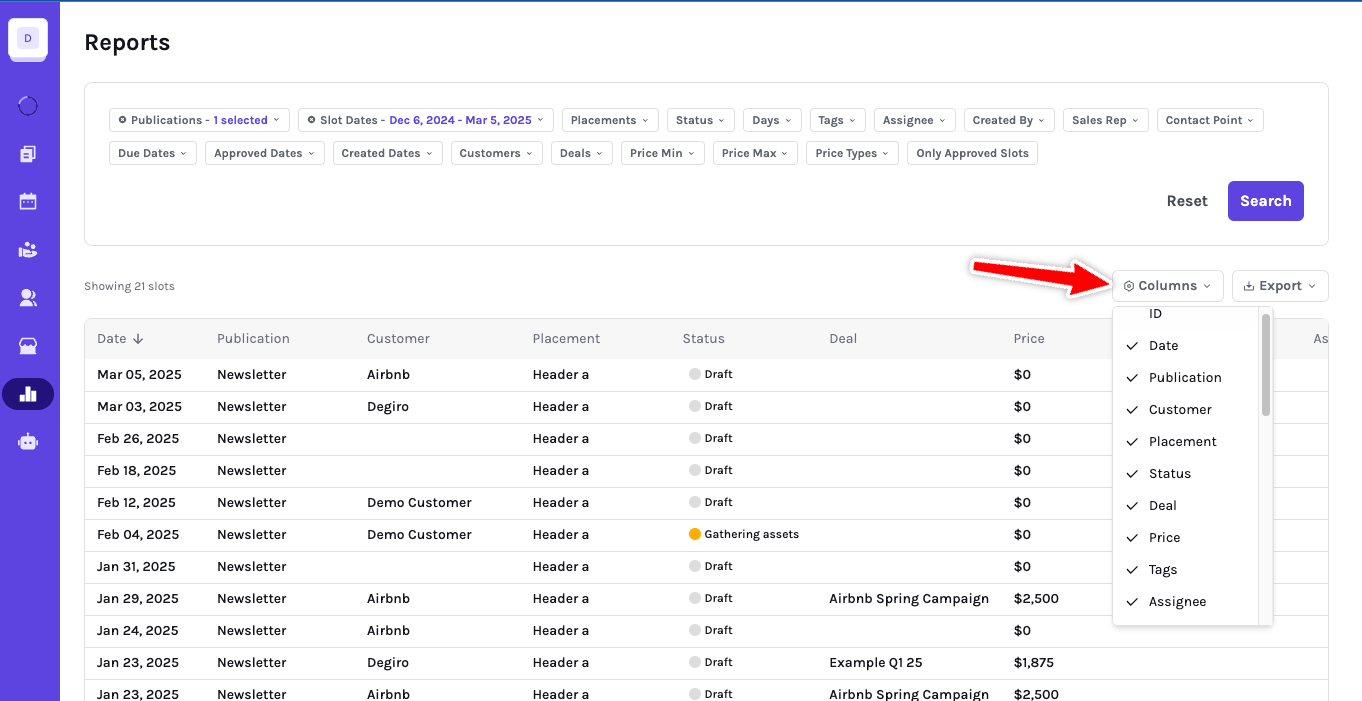
Tailor your data view by selecting or deselecting columns using the Columns option located at the top right corner of the table. Your visible columns control what you see in the report and what gets included when you export the current view.
Flight dates and sorting
In Deals reports, the Flight dates column shows the earliest scheduled start and latest end of the deal's booked units. A single-day booking uses its scheduled day as its end date. Deleted bookings, undated bookings and invalid date ranges do not contribute to the range. A deal without a usable booked date shows a dash. These dates come from the bookings, not the optional date entered on the deal.
When Reporting readiness is active, the flight range uses the same placement exclusions. For example, excluding a long-running discount code keeps its end date out of both the flight range and the readiness calculation.
Deals reports start with the latest flight end first, with undated deals last. Click a column header to change the column or direction. Sorting happens before result pages are selected, so it applies across every page. Changing the sort returns to the first page. Save the report to keep the selected order; reports without a saved order use the latest flight end.
Editing deal custom fields
You can edit text and date custom fields directly in a Deals report when your plan and deal-update permissions allow it. This is useful for fields such as Report Send Date, Invoice Number, and Invoice Send Date.
Click the field's cell to open its editor, enter a value, then choose Save or Cancel. Use Clear to remove an optional field's value before saving. Required fields must keep a value. Saving updates that field on the shared deal and refreshes the report. If the new value no longer matches the report's filters, the deal leaves the results. Other custom fields on the deal keep their values.
These fields record information about your workflow. Editing an invoice number or send date does not issue an invoice or record a payment. Users without deal-update permission can still view the fields they have access to, but cannot edit them here.
Saved reports
After configuring filters, columns, entity type, sorting, and chart options, save the report so you can reopen it later from the Saved Reports sidebar. Saving reports is available on every plan.
On Pro and Custom, you can also share workspace reports by email when you need to send the same report setup to another teammate.
Charts
Turn on Plot to visualize the current report above the table. You can choose Bar, Line, Scatter, or Pie charts, then configure the X and Y axes, optional grouping, and aggregation method.
Supported aggregations include Sum, Average, and Count. Chart settings are saved with the report, so the visualization is restored when you reopen it.
Exporting Reports
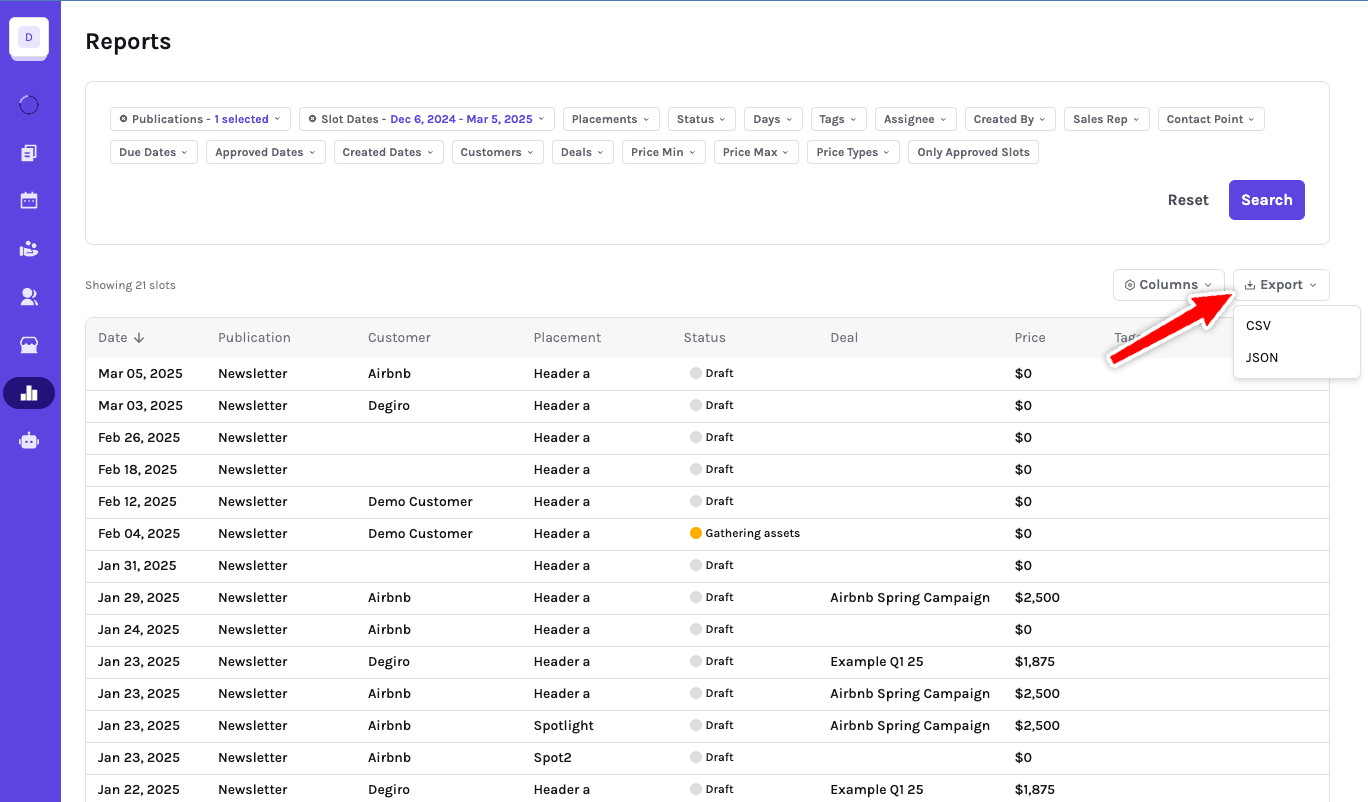
On Pro and Custom, use Export to download the current report as CSV or JSON. Exports respect your current filters and visible columns.
For deal reports, use the line-item export when you need each deal broken down into the publication, placement, date, customer, and price rows that make up the deal. This is useful for finance reviews, campaign reconciliation, and spreadsheet handoffs.
Tracked deals keep their aggregate Conversions metric and show event names in a separate Tracked events panel. Each event separates last-touch conversions from assisted attribution. In Deal → Metrics → Per-Slot Breakdown, expand a slot to see the event counts for that run.
When deal conversion tracking is enabled, Sponsy uses the visitor's 30-day sponsored-click path. The newest valid slot receives last-touch credit. Earlier distinct slots receive assisted credit. Cross-publisher touches can contribute without exposing another publisher's slot details.
Tracked-event CSVs include the event, slot label, slot ID, run date, publication, placement, attribution role, and count. The per-slot export and Export all include event rows for slots matching the current table filters. The deal-level Tracked events download covers the whole deal. Dates use YYYY-MM-DD; undated slots retain their slot ID.
URL builder in reports
The publication-level URL builder helps keep sponsor URLs consistent by applying the right query parameters when slot content is saved. Cleaner links make exported reports easier to reconcile with campaign, publication, placement, deal, and slot data.
By leveraging Sponsy’s Reports module — together with Metrics for workspace-wide analytics — you gain a comprehensive understanding of your sponsorship performance, empowering you to make data-driven decisions that enhance revenue and optimize your sponsorship strategies.